The Complete Meta Ads Dashboard Explained (With Visuals)
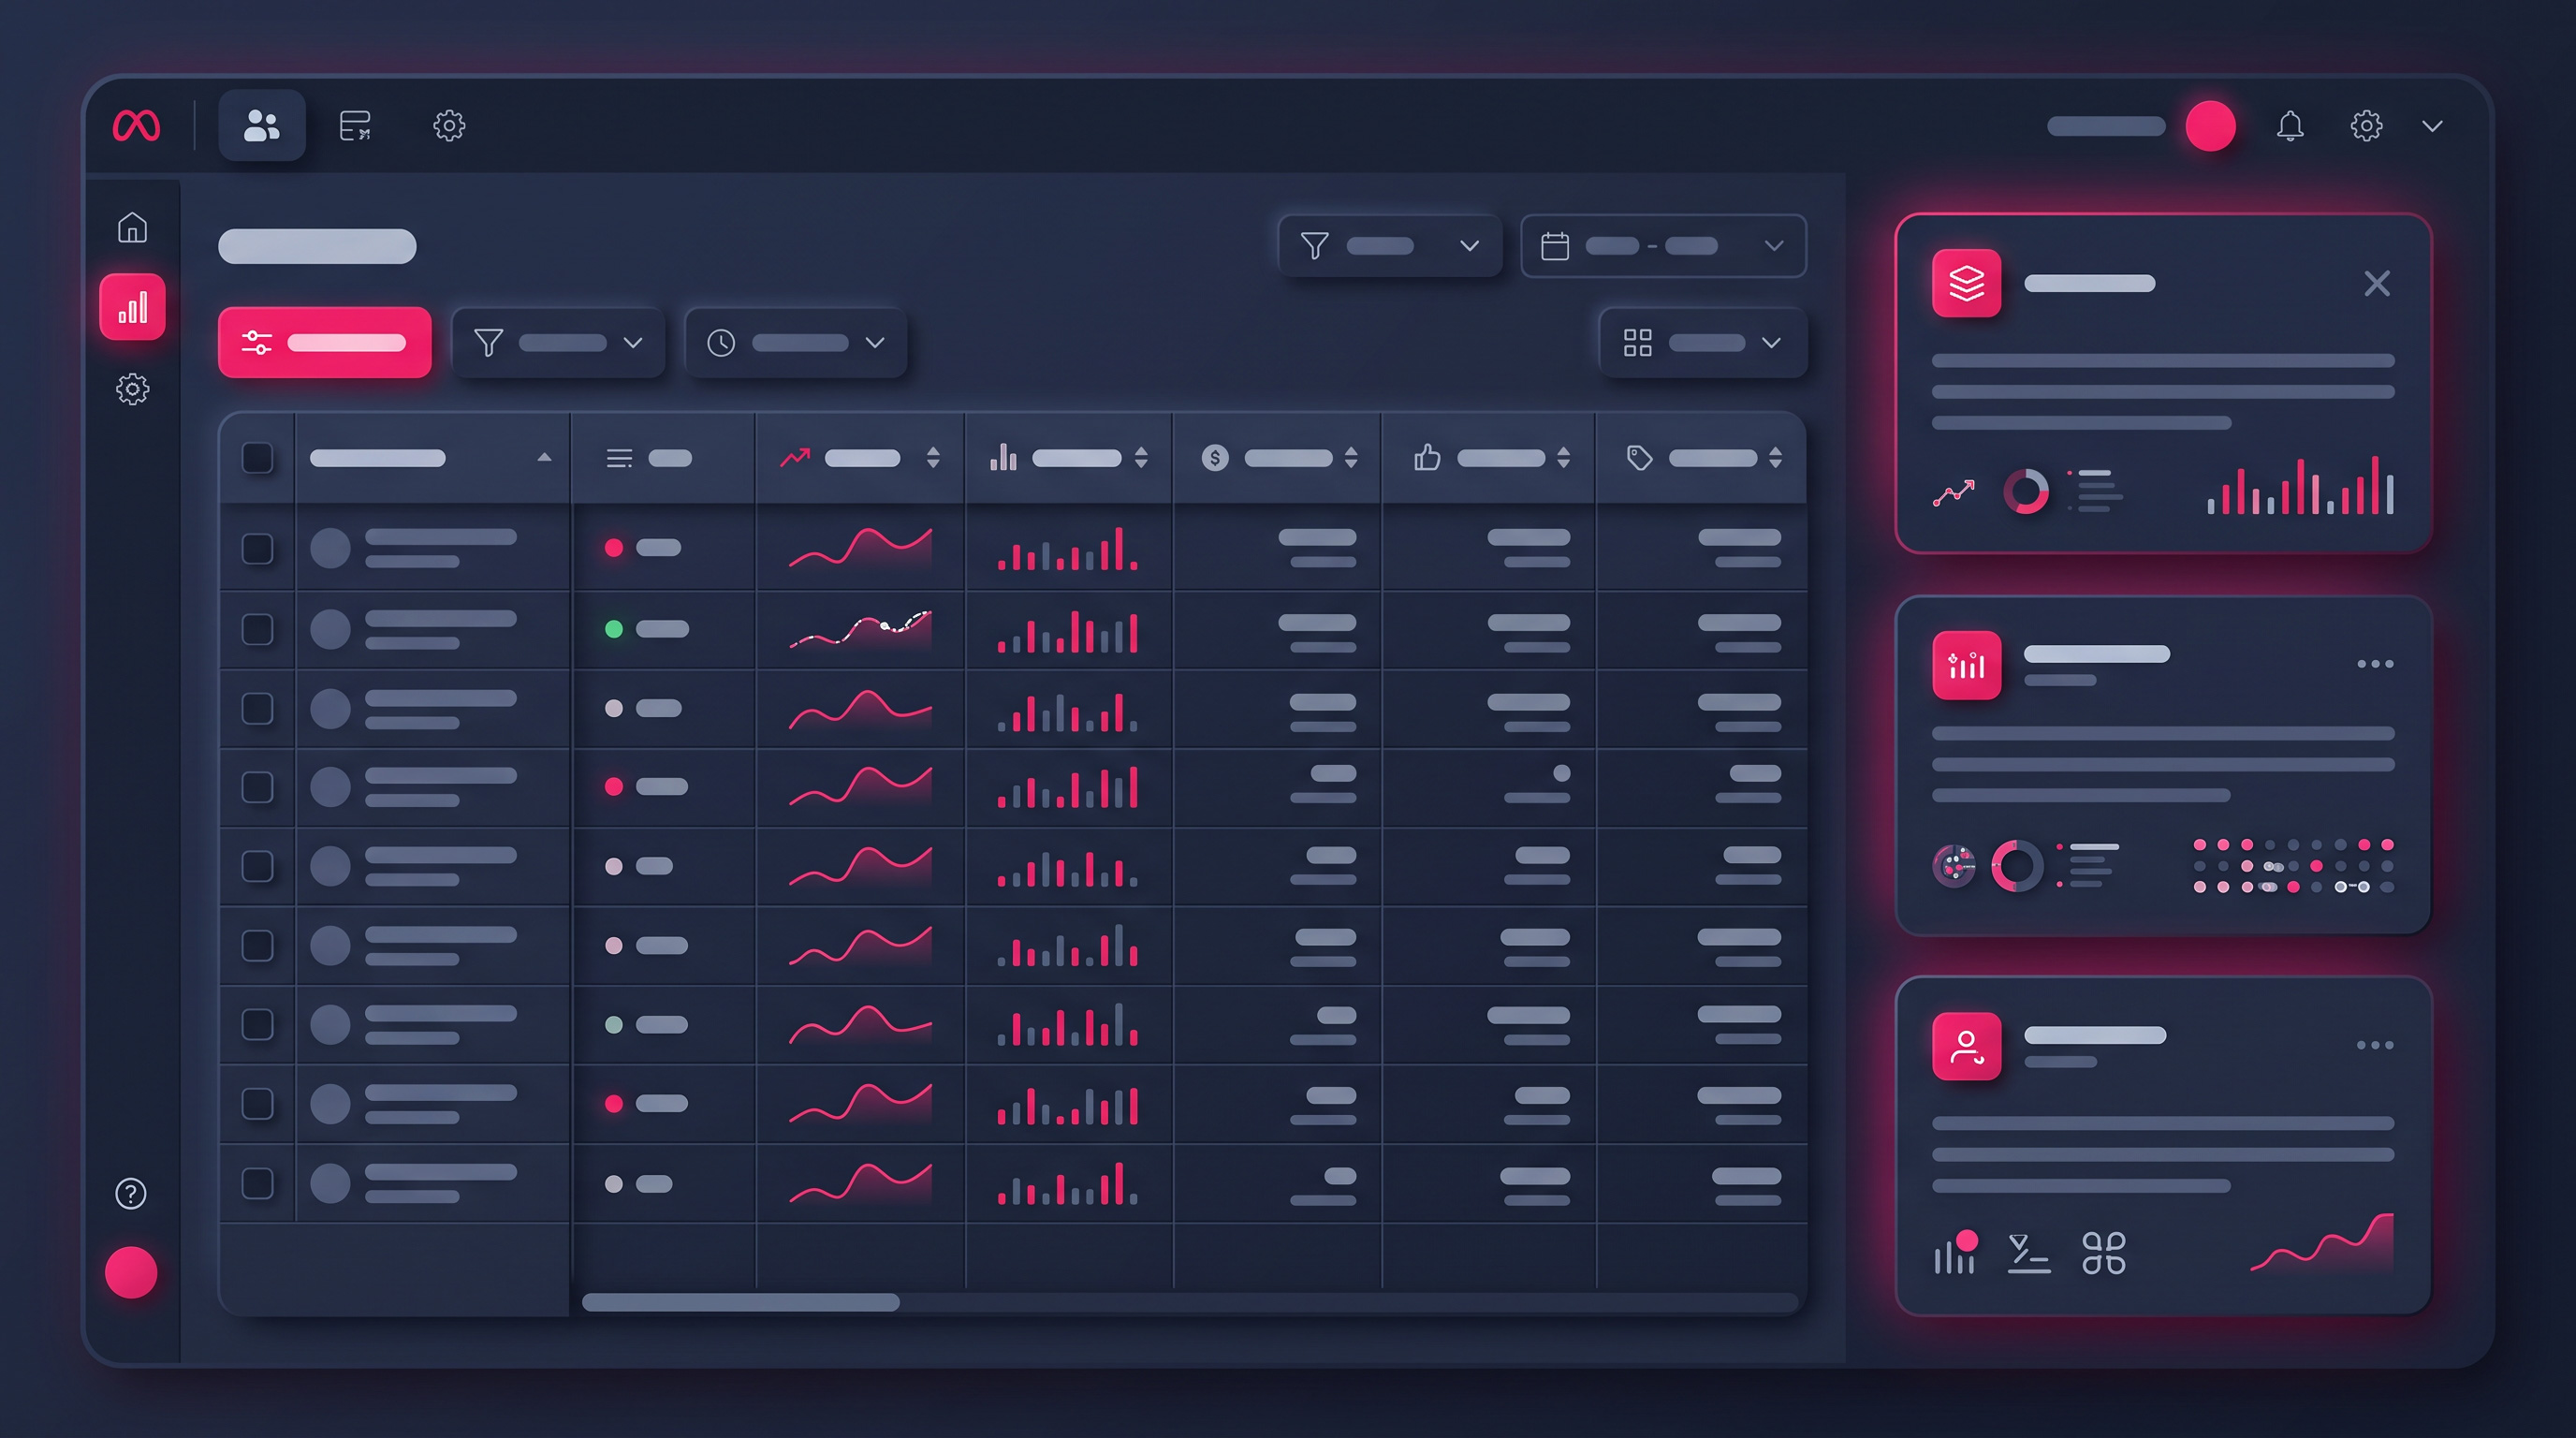
Meta’s Ads Manager throws dozens of numbers at you, and most businesses misread them — celebrating vanity metrics while the numbers that actually decide profit sit ignored. Yet once you understand what each part of the dashboard is telling you, it stops being intimidating and becomes the clearest map you have of where your money is going and what it’s buying. This guide walks through the whole Meta Ads dashboard, section by section, with a visual of each one, so you can read your campaigns with confidence before you spend another rupee.
Key takeaways
- The dashboard has six areas: performance, overview, conversions, audience, creative, and budget control.
- Performance metrics show delivery and interest; conversion metrics show what actually grows the business.
- Read metrics together — a single number in isolation almost always misleads.
- Audience and creative data tell you where to move budget and which ads to scale.
- Respect the learning phase and attribution window, or your data becomes unreliable.
Why reading the dashboard properly matters
Most wasted ad budget doesn’t come from bad products or even bad ads — it comes from misreading the data and making the wrong call. Someone sees a high number of impressions and assumes the campaign is working; someone else panics at a low click-through rate on a campaign that’s quietly generating sales. The dashboard tells the truth, but only if you know which numbers answer which questions. Let’s go through it the way it’s actually laid out, one section at a time.
1. Core performance metrics
This is the top layer of the dashboard, and it tells you how your ads are being delivered and whether people are engaging. Impressions, reach, and frequency describe how widely and how often your ad is being shown; CPM tells you what that exposure costs; clicks, CTR, and CPC tell you whether people are responding. None of these are the final word on success, but together they’re the pulse of your campaign.
The mistake to avoid is treating any one of them as a verdict. A high impression count means nothing if nobody clicks; a low CPC is worthless if those cheap clicks never convert. Read them as a set, as shown below, and you get a genuine picture of delivery and interest.
2. Campaign overview
The overview is your bird’s-eye view: the name of each campaign, its objective, whether it’s currently active or paused, how much of its budget has been spent, and the headline results it’s driving. It’s the first thing to check when you log in, because it tells you at a glance whether everything is running as intended and whether spend is pacing sensibly.
Pay special attention to the objective and delivery status. A campaign optimising for the wrong objective will spend happily while producing the wrong outcomes, and a campaign stuck “in review” or accidentally paused is a silent problem. The overview is where you catch those before they cost you.
3. Conversion metrics
This is where the real business questions get answered. Conversion metrics track the actions that actually make you money — leads, purchases, add-to-carts — alongside the cost per result, the total conversion value, and your return on ad spend. If the performance section is about attention, this section is about outcomes, and it’s the one to anchor your decisions on.
The single most important habit here is to judge campaigns by cost per result and ROAS, not by clicks or impressions. A campaign with fewer clicks but a lower cost per purchase is usually the better performer. Just remember, as we covered in our guide to core marketing metrics, that a strong ROAS still needs healthy margins behind it to translate into actual profit.
4. Audience insights
Audience insights tell you who is actually responding to your ads: their age and gender, where they live, and whether they’re on mobile, desktop, or tablet. This is some of the most actionable data in the whole dashboard, because it shows you where your money is working hardest — and where it’s being wasted on people who never convert.
For Pakistani businesses this section is especially valuable. It quickly reveals which cities and age groups drive your results, and it almost always confirms that the vast majority of your audience is on mobile — which should shape both your targeting and the way you design your ads and landing pages.
One number never tells the story: the whole point of the dashboard is cross-referencing. Reach explains frequency, frequency explains CPM, CTR explains CPC, and conversion value explains whether any of it mattered. Always read across sections before you judge a campaign.
5. Creative performance
Creative performance shows which of your actual ads — which images, videos, and copy — are connecting with people. It highlights your best performer, compares image against video, measures engagement, and shows the hook rate: how well an ad grabs attention in its opening seconds. In practice, your creative is the single biggest lever on results, so this section deserves real attention.
Use it to make one decision repeatedly: put more budget behind what’s working and retire what isn’t. A weak hook rate usually means the first few seconds need fixing before anything else; a strong performer is a signal to produce more in the same style. Let the data, not your personal taste, choose your winning creative.
6. Budget and delivery control
The final section governs how your money is spent and how the algorithm behaves. It covers your daily versus lifetime budget, the learning phase, your bid strategy, the attribution setting, and how much budget remains. These aren’t glamorous, but they quietly determine whether your campaign stays stable or lurches around unpredictably.
Two settings matter most here. First, respect the learning phase: making big changes while the algorithm is still learning resets its progress and wastes budget. Second, keep your attribution window consistent, because changing it mid-campaign makes your results impossible to compare. Manage this section with patience and intent, and everything upstream becomes more reliable.
The bottom line
The Meta Ads dashboard isn’t complicated once you know what each section is for: performance metrics show delivery and interest, the overview shows structure, conversion metrics show real outcomes, audience and creative data tell you what to scale, and budget control keeps it all stable. Read across the sections rather than fixating on any single number, anchor your decisions on cost per result and ROAS, and the dashboard becomes a tool for making money rather than a wall of confusing figures. If you’d rather have experts run and read it for you, that’s exactly what our team does every day.
Want your ads managed by people who read the data?
We set up, run, and report on Meta and Google campaigns for Pakistani businesses — with the dashboard read properly so every rupee works toward real results. Tell us your goals and get a clear plan within 24 hours.
Frequently asked questions
Which Meta metric should I care about most?
For most businesses, cost per result and ROAS matter most, because they connect spend to actual outcomes. Impressions, reach, and clicks describe activity, but they don’t tell you whether you made money. Anchor your decisions on conversion metrics and use the rest as supporting context.
What is the learning phase in Meta ads?
It’s the period when Meta’s algorithm is still figuring out how to deliver your ad most effectively. During it, results can be unstable. Making major changes — to budget, audience, or creative — resets the learning and wastes spend, so it’s best to let a campaign settle before judging or adjusting it heavily.
Why do my reported results change depending on the attribution setting?
The attribution setting defines the window of time in which a click or view is credited with a conversion. A wider window credits more conversions to your ads, a narrower one fewer. That’s why you should pick one setting and keep it consistent — otherwise you’re comparing numbers measured in different ways.
Is a high CTR always good?
Usually it’s a positive sign that your ad is relevant and engaging, but it’s not the whole story. A high click-through rate that doesn’t lead to conversions means people are interested but not converting — often a landing page or offer problem. Always read CTR alongside your conversion metrics.
How often should I check my Meta dashboard?
Check the overview daily for spend pacing and delivery status, but avoid making decisions on day-to-day swings. Judge performance over a longer window — usually a week or more of stable data — so you’re reacting to real trends, not the normal noise of a campaign that’s still learning. Frequent knee-jerk changes do more harm than good.
Related articles

Social Media Content Creation for Pakistani Businesses
What to post, how to plan it, and how to make social media content that actually grows a Pakistani business.

8 Meta Ad Settings You Must Turn Off
Meta's default settings inflate your numbers, alter your creative and waste budget. Here are 8 specific Ads Manager settings to turn off…
Core Marketing Metrics Explained Simply (With Examples)
CAC, LTV, churn, ROAS, NPS and more — the 8 core marketing metrics every business owner should understand, explained in plain language…